In my last post I shared details on how to automate chart rendered on HTML Canvas element in AngularJS application (https://softwareexertus.blogspot.com/2020/01/chart-automation-extracting-data-from_24.html). We learned how to use angular scope to retrieve data from canvas. This post I would like to share how to automate chart rendered on html canvas in a ReactJS application using react props. So without further delay lets get started.
For demontration purpose I am using the source code/sample shared in https://canvasjs.com/docs/charts/integration/react/. Click on the Free code sample link and build the same locally by following the below commands:
1) Navigate to 'react-canvasjs-chart-samples' (extracted folder) in Command Prompt
2) Run 'npm install' to install all npm dependencies
3) Run 'npm start' to run the project
This should open the demo application at http://localhost:3000/ if installation is successful.
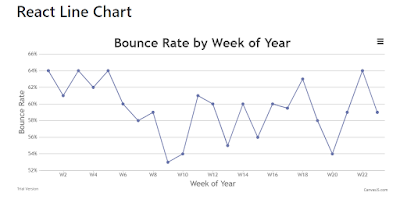
Now open the link http://localhost:3000/line-chart which will look like below.We are going to use this chart as example for this post.
Lets inspect the canvas element :

We are going to follow the below steps for extracting the information we need from the canvas element:
Step 1: Find the element using javascript by selector (id/tagname/classname etc) like document.getElementById. Make sure you are finding the parent element of the canvas under test here, not the canvas element.
Step 2: Enable access to react component from its dom node using javascript again.
Step 3: Use React prop to get the details we need like chart title, data, tooltip text, color etc. More details on what is react prop can be found in https://reactjs.org/docs/components-and-props.html
The following java script function will enable access to react component from its dom node, run the same from console:

Using the below commands we will have the global react element to play around:

Finally we are going to use react props to get the details we are looking for like chart title, data etc.


